Grundlæggende statistik
| Institutionelle ejere | 154 total, 150 long only, 0 short only, 4 long/short - change of % MRQ |
| Gennemsnitlig porteføljeallokering | 0.3997 % - change of % MRQ |
| Institutionelle aktier (lange) | 54.166.064 (ex 13D/G) |
| Institutionel værdi (lang) | $ 152.405 USD ($1000) |
Institutionelt ejerskab og aktionærer
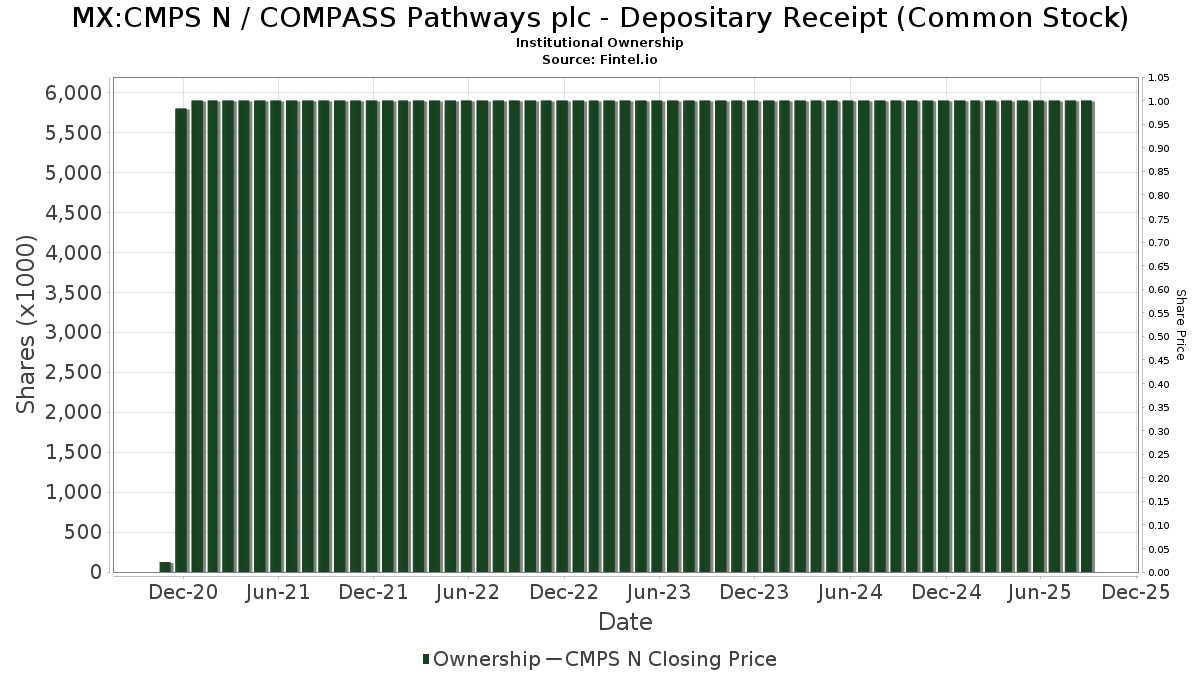
COMPASS Pathways plc - Depositary Receipt (Common Stock) (MX:CMPS N) har 154 institutionelle ejere og aktionærer, der har indsendt 13D/G- eller 13F-formularer til Securities Exchange Commission (SEC). Disse institutioner har i alt 54,166,064 aktier. Største aktionærer omfatter Deep Track Capital, LP, Rtw Investments, Lp, Nantahala Capital Management, LLC, Vivo Capital, LLC, Gmt Capital Corp, PFM Health Sciences, LP, Woodline Partners LP, Millennium Management Llc, UBS Group AG, and ARKG - ARK Genomic Revolution ETF .
COMPASS Pathways plc - Depositary Receipt (Common Stock) (BMV:CMPS N) institutionel ejerskabsstruktur viser aktuelle positioner i virksomheden efter institutioner og fonde, samt seneste ændringer i positionsstørrelse. Større aktionærer kan omfatte individuelle investorer, investeringsforeninger, hedgefonde eller institutioner. Skema 13D angiver, at investoren besidder (eller besidder) mere end 5 % af virksomheden og har til hensigt (eller har til hensigt at) aktivt at forfølge en ændring i forretningsstrategi. Skema 13G indikerer en passiv investering på over 5%.
Fondens stemningsscore
Fund Sentiment Score (fka Ownership Accumulation Score) finder de aktier, der bliver mest købt af fonde. Det er resultatet af en sofistikeret, multi-faktor kvantitativ model, der identificerer virksomheder med de højeste niveauer af institutionel akkumulering. Scoringsmodellen bruger en kombination af den samlede stigning i oplyste ejere, ændringerne i porteføljeallokeringer i disse ejere og andre målinger. Tallet går fra 0 til 100, hvor højere tal indikerer et højere niveau af akkumulering for sine jævnaldrende, og 50 er gennemsnittet.
Opdateringsfrekvens: Dagligt
Se Ownership Explorer, som giver en liste over højest rangerende virksomheder.
13F og NPORT arkivering
Detaljer om 13F-arkivering er gratis. Detaljer om NP-ansøgninger kræver et premium-medlemskab. Grønne rækker angiver nye positioner. Røde rækker angiver lukkede positioner. Klik på linket ikon for at se den fulde transaktionshistorik.
Opgrader
for at låse premium-data op og eksportere til Excel ![]() .
.
| Fil dato | Kilde | Investor | Type | Gennemsnitlig pris (Øst) |
Aktier | Δ Aktier (%) |
Rapporteret Værdi ($1000) |
Δ Værdi (%) |
Port Alloc (%) |
|
|---|---|---|---|---|---|---|---|---|---|---|
| 2025-08-14 | 13F | Toronto Dominion Bank | 500.000 | 1.400 | ||||||
| 2025-08-28 | NP | IBB - iShares Nasdaq Biotechnology ETF | 332.413 | -17,85 | 931 | -19,62 | ||||
| 2025-08-14 | 13F | Schonfeld Strategic Advisors LLC | 186.881 | 523 | ||||||
| 2025-07-25 | 13F | Cwm, Llc | 13.125 | 20,91 | 0 | |||||
| 2025-08-15 | 13F | Tower Research Capital LLC (TRC) | 0 | -100,00 | 0 | -100,00 | ||||
| 2025-04-07 | 13F | AdvisorNet Financial, Inc | 0 | -100,00 | 0 | |||||
| 2025-08-13 | 13F/A | DLD Asset Management, LP | Call | 231.600 | 648 | |||||
| 2025-08-28 | NP | GWX - SPDR(R) S&P(R) International Small Cap ETF | 24.111 | -1,57 | 68 | -4,29 | ||||
| 2025-08-13 | 13F/A | DLD Asset Management, LP | 10.500 | 29 | ||||||
| 2025-08-14 | 13F | Rosalind Advisors, Inc. | 482.651 | -41,38 | 1.351 | -42,61 | ||||
| 2025-08-14 | 13F | Gmt Capital Corp | 1.781.718 | 0,00 | 4.989 | -2,10 | ||||
| 2025-08-13 | 13F | Kennedy Capital Management, Inc. | 0 | -100,00 | 0 | |||||
| 2025-07-29 | 13F | Stableford Capital Ii Llc | 163.941 | 710 | ||||||
| 2025-08-14 | 13F/A | Barclays Plc | 417.644 | -0,76 | 1 | 0,00 | ||||
| 2025-08-14 | 13F | 22nw, Lp | 882.844 | 36,55 | 2.472 | 33,64 | ||||
| 2025-08-11 | 13F | Rothschild Investment Llc | 304 | 1,33 | 1 | |||||
| 2025-08-12 | 13F | BlackRock, Inc. | 377.060 | -8,46 | 1.056 | -10,44 | ||||
| 2025-08-14 | 13F | Jane Street Group, Llc | Call | 17.200 | 59,26 | 48 | 60,00 | |||
| 2025-07-08 | 13F | Parallel Advisors, LLC | 85 | -36,57 | 0 | |||||
| 2025-08-08 | 13F | SBI Securities Co., Ltd. | 658 | 532,69 | 2 | |||||
| 2025-08-14 | 13F | Nantahala Capital Management, LLC | 4.179.930 | 47,74 | 11.704 | 44,64 | ||||
| 2025-08-14 | 13F | Jane Street Group, Llc | 157.677 | 441 | ||||||
| 2025-08-14 | 13F | Tang Capital Management Llc | 1.300.000 | -7,14 | 3.640 | -9,09 | ||||
| 2025-05-15 | 13F | Two Sigma Securities, Llc | 0 | -100,00 | 0 | -100,00 | ||||
| 2025-07-11 | 13F | Adirondack Trust Co | 505 | 0,00 | 1 | 0,00 | ||||
| 2025-05-15 | 13F | Ikarian Capital, LLC | 0 | -100,00 | 0 | -100,00 | ||||
| 2025-07-30 | 13F | LGT Financial Advisors LLC | 14.700 | 0,00 | 41 | -2,38 | ||||
| 2025-07-24 | NP | FNCMX - Fidelity Nasdaq Composite Index Fund This fund is a listed as child fund of Fmr Llc and if that institution has disclosed ownership in this security, then these positions will not be double counted when calculating total shares and total value | 42.169 | 0,00 | 175 | 6,06 | ||||
| 2025-07-14 | 13F | GAMMA Investing LLC | 5.739 | -44,55 | 16 | -44,83 | ||||
| 2025-08-14 | 13F | Boston Private Wealth Llc | 0 | -100,00 | 0 | |||||
| 2025-08-14 | 13F | Group One Trading, L.p. | 117.683 | 143,71 | 330 | 138,41 | ||||
| 2025-08-13 | 13F | Walleye Trading LLC | Call | 284.000 | 13,28 | 795 | 10,88 | |||
| 2025-08-14 | 13F | Deep Track Capital, LP | 8.831.007 | -0,32 | 24.727 | -2,42 | ||||
| 2025-08-14 | 13F | UBS Group AG | 1.678.608 | 60,00 | 4.700 | 56,67 | ||||
| 2025-07-14 | 13F | Pacifica Partners Inc. | 420 | 0,00 | 1 | 0,00 | ||||
| 2025-04-21 | 13F | Nelson, Van Denburg & Campbell Wealth Management Group, LLC | 0 | -100,00 | 0 | |||||
| 2025-05-29 | 13F/A | Legal & General Group Plc | 33.952 | 204 | ||||||
| 2025-06-25 | NP | ARKG - ARK Genomic Revolution ETF | 1.658.908 | -1,59 | 6.602 | -9,13 | ||||
| 2025-07-16 | 13F | Signaturefd, Llc | 1 | 0,00 | 0 | |||||
| 2025-09-02 | 13F | Investors Towarzystwo Funduszy Inwestycyjnych Spolka Akcyjna | 0 | -100,00 | 0 | -100,00 | ||||
| 2025-08-13 | 13F | Hsbc Holdings Plc | 1.075.485 | 3.011 | ||||||
| 2025-08-04 | 13F | Flagship Harbor Advisors, Llc | 28.171 | 95,01 | 79 | 90,24 | ||||
| 2025-08-07 | 13F | Hennion & Walsh Asset Management, Inc. | 160.767 | -4,42 | 450 | -6,44 | ||||
| 2025-08-18 | 13F/A | National Bank Of Canada /fi/ | 98 | 0 | ||||||
| 2025-08-13 | 13F | Walleye Capital LLC | Put | 5.100 | 14 | |||||
| 2025-08-06 | 13F | Ethos Financial Group, LLC | 12.308 | 0,00 | 34 | -2,86 | ||||
| 2025-08-13 | 13F | Colonial Trust Advisors | 2.000 | 0,00 | 6 | 0,00 | ||||
| 2025-08-08 | 13F | Brown University | 214.200 | 0,00 | 600 | -2,12 | ||||
| 2025-08-13 | 13F | Walleye Capital LLC | 851 | 2 | ||||||
| 2025-08-14 | 13F | Woodline Partners LP | 1.755.938 | 0,06 | 4.917 | -2,03 | ||||
| 2025-08-13 | 13F | Walleye Capital LLC | Call | 6.300 | 18 | |||||
| 2025-08-19 | 13F | Anchor Investment Management, LLC | 550 | 0,00 | 2 | 0,00 | ||||
| 2025-05-14 | 13F | Affinity Asset Advisors, LLC | 0 | -100,00 | 0 | |||||
| 2025-07-23 | 13F | Shell Asset Management Co | 0 | -100,00 | 0 | |||||
| 2025-08-08 | 13F | Larson Financial Group LLC | 112 | 0,00 | 0 | |||||
| 2025-08-14 | 13F | Boothbay Fund Management, Llc | 700.000 | 1.023,60 | 1.960 | 1.001,12 | ||||
| 2025-07-24 | 13F | Ronald Blue Trust, Inc. | 150 | -94,64 | 0 | -100,00 | ||||
| 2025-08-14 | 13F | Citadel Advisors Llc | 132.902 | -82,17 | 372 | -82,54 | ||||
| 2025-08-14 | 13F | Laurion Capital Management LP | 0 | -100,00 | 0 | |||||
| 2025-08-14 | 13F | Citadel Advisors Llc | Call | 12.100 | -36,65 | 34 | -38,89 | |||
| 2025-08-14 | 13F | Citadel Advisors Llc | Put | 227.600 | 11,68 | 637 | 9,45 | |||
| 2025-07-29 | 13F | TFC Financial Management | 52 | 0,00 | 0 | |||||
| 2025-08-05 | 13F | Key FInancial Inc | 2.500 | 7 | ||||||
| 2025-08-14 | 13F | Boothbay Fund Management, Llc | Call | 500.000 | 1.400 | |||||
| 2025-08-14 | 13F | Boothbay Fund Management, Llc | Put | 100.000 | 280 | |||||
| 2025-08-12 | 13F | SRS Capital Advisors, Inc. | 240 | 100,00 | 1 | |||||
| 2025-08-13 | 13F | Virtus Investment Advisers, Inc. | 20.804 | -44,11 | 58 | -45,28 | ||||
| 2025-08-27 | 13F/A | Squarepoint Ops LLC | 0 | -100,00 | 0 | -100,00 | ||||
| 2025-08-27 | 13F/A | Squarepoint Ops LLC | Put | 0 | -100,00 | 0 | -100,00 | |||
| 2025-08-13 | 13F | Schroder Investment Management Group | 544.721 | 1.525 | ||||||
| 2025-08-14 | 13F | Shay Capital LLC | 100.000 | -23,96 | 280 | -25,53 | ||||
| 2025-08-08 | 13F | Pnc Financial Services Group, Inc. | 200 | 0,00 | 1 | |||||
| 2025-08-04 | 13F | AdvisorShares Investments LLC | 173.541 | 23,48 | 486 | 23,72 | ||||
| 2025-08-14 | 13F | Driehaus Capital Management Llc | 236.686 | -66,27 | 663 | -67,02 | ||||
| 2025-08-12 | 13F | Proequities, Inc. | 0 | 0 | ||||||
| 2025-08-12 | 13F | XTX Topco Ltd | 78.560 | 220 | ||||||
| 2025-07-30 | 13F | ARK Investment Management LLC | 1.649.221 | -8,62 | 4.618 | -10,54 | ||||
| 2025-08-11 | 13F | Blue Owl Capital Holdings LP | 229.914 | -79,76 | 644 | -80,20 | ||||
| 2025-08-12 | 13F | Pathstone Holdings, LLC | 11.425 | -17,14 | 32 | -20,51 | ||||
| 2025-08-12 | 13F | Close Asset Management Ltd | 3.900 | 0,00 | 0 | |||||
| 2025-08-12 | 13F | Rhumbline Advisers | 3.728 | 276,57 | 10 | 400,00 | ||||
| 2025-07-15 | 13F | North Star Investment Management Corp. | 517 | -84,67 | 1 | -88,89 | ||||
| 2025-08-05 | 13F | GHP Investment Advisors, Inc. | 250 | 0,00 | 1 | |||||
| 2025-08-11 | 13F | Principal Securities, Inc. | 441 | 53,12 | 1 | 0,00 | ||||
| 2025-08-11 | 13F | Alps Advisors Inc | 50.433 | -23,85 | 141 | -25,40 | ||||
| 2025-08-01 | 13F | Davy Global Fund Management Ltd | 23.842 | 67,04 | 67 | 65,00 | ||||
| 2025-08-14 | 13F | Royal Bank Of Canada | 178.200 | 99,23 | 499 | 94,92 | ||||
| 2025-05-09 | 13F | Altium Capital Management LP | 0 | -100,00 | 0 | |||||
| 2025-08-25 | NP | PSIL - AdvisorShares Psychedelics ETF | 173.541 | 23,48 | 486 | 20,95 | ||||
| 2025-07-21 | 13F | Mirae Asset Global Investments Co., Ltd. | 3.514 | 74,57 | 10 | 80,00 | ||||
| 2025-05-14 | 13F | Northwestern Mutual Wealth Management Co | 0 | -100,00 | 0 | |||||
| 2025-08-14 | 13F | Two Sigma Advisers, Lp | 0 | -100,00 | 0 | |||||
| 2025-08-14 | 13F | Bnp Paribas Arbitrage, Sa | 1.445 | 54,88 | 4 | 100,00 | ||||
| 2025-08-11 | 13F | EntryPoint Capital, LLC | 35.936 | -69,46 | 101 | -70,24 | ||||
| 2025-08-08 | 13F | New England Capital Financial Advisors LLC | 404 | 34,67 | 1 | |||||
| 2025-07-15 | 13F | Missouri Trust & Investment Co | 30 | 0,00 | 0 | |||||
| 2025-07-23 | 13F | Prime Capital Investment Advisors, LLC | 0 | -100,00 | 0 | |||||
| 2025-05-15 | 13F | Marshall Wace, Llp | 0 | -100,00 | 0 | |||||
| 2025-07-31 | 13F | Conservest Capital Advisors, Inc. | 20.363 | 32,55 | 57 | 32,56 | ||||
| 2025-07-31 | 13F | Sumitomo Mitsui Trust Holdings, Inc. | 219.651 | -4,55 | 615 | -6,53 | ||||
| 2025-08-14 | 13F | Rtw Investments, Lp | 8.221.929 | 48,46 | 23.021 | 45,34 | ||||
| 2025-06-26 | NP | OWSMX - Old Westbury Small & Mid Cap Strategies Fund | 0 | -100,00 | 0 | -100,00 | ||||
| 2025-08-08 | 13F | BIT Capital GmbH | 0 | -100,00 | 0 | |||||
| 2025-08-15 | 13F | Morgan Stanley | 265.833 | -59,20 | 744 | -60,06 | ||||
| 2025-08-13 | 13F | EverSource Wealth Advisors, LLC | 2.780 | -23,39 | 8 | -30,00 | ||||
| 2025-08-14 | 13F | GWM Advisors LLC | 550 | 0,00 | 2 | 0,00 | ||||
| 2025-08-11 | 13F | TD Waterhouse Canada Inc. | 1.770 | 0,00 | 6 | 25,00 | ||||
| 2025-08-12 | 13F | Steward Partners Investment Advisory, Llc | 1.100 | 0,00 | 3 | 0,00 | ||||
| 2025-08-13 | 13F | Walleye Trading LLC | 0 | -100,00 | 0 | -100,00 | ||||
| 2025-05-15 | 13F | Cubist Systematic Strategies, LLC | 0 | -100,00 | 0 | |||||
| 2025-08-28 | 13F | China Universal Asset Management Co., Ltd. | 18.272 | 46,70 | 51 | 45,71 | ||||
| 2025-08-14 | 13F | Federation des caisses Desjardins du Quebec | 175 | -63,16 | 0 | -100,00 | ||||
| 2025-08-14 | 13F | Susquehanna Fundamental Investments, Llc | 71.877 | -1,84 | 201 | -3,83 | ||||
| 2025-05-08 | 13F | Essential Planning, LLC. | 0 | -100,00 | 0 | |||||
| 2025-07-31 | 13F | Caitong International Asset Management Co., Ltd | 0 | -100,00 | 0 | |||||
| 2025-08-14 | 13F | Polar Asset Management Partners Inc. | 58.006 | -74,76 | 162 | -75,34 | ||||
| 2025-08-14 | 13F | Balyasny Asset Management Llc | 854.840 | 37,99 | 2.394 | 35,12 | ||||
| 2025-08-14 | 13F | Ancora Advisors, LLC | 1.330 | 0,00 | 4 | 0,00 | ||||
| 2025-08-05 | 13F | Simplex Trading, Llc | 183.031 | 276,21 | 1 | |||||
| 2025-07-07 | 13F | Global Wealth Strategies & Associates | 12 | 0 | ||||||
| 2025-08-13 | 13F | Virtus ETF Advisers LLC | 10.223 | -75,48 | 29 | -76,47 | ||||
| 2025-07-28 | NP | BIB - ProShares Ultra Nasdaq Biotechnology | 2.284 | 3,77 | 10 | 12,50 | ||||
| 2025-05-13 | 13F | Simplify Asset Management Inc. | 0 | -100,00 | 0 | |||||
| 2025-05-15 | 13F | Integral Health Asset Management, LLC | 0 | -100,00 | 0 | |||||
| 2025-08-14 | 13F | Vivo Capital, LLC | 3.362.385 | 0,00 | 9.415 | -2,10 | ||||
| 2025-08-14 | 13F | Goldman Sachs Group Inc | 244.893 | 931,30 | 686 | 922,39 | ||||
| 2025-08-14 | 13F | Goldman Sachs Group Inc | Call | 141.800 | 397 | |||||
| 2025-08-14 | 13F | Bank Of America Corp /de/ | 18.481 | 1,23 | 52 | -1,92 | ||||
| 2025-05-02 | 13F | Wealthfront Advisers Llc | 0 | -100,00 | 0 | -100,00 | ||||
| 2025-08-11 | 13F | Anfield Capital Management, LLC | 35 | 0,00 | 0 | |||||
| 2025-08-14 | 13F | Peak6 Llc | 13.395 | -58,01 | 38 | -59,34 | ||||
| 2025-05-15 | 13F | CAPROCK Group, Inc. | 10.223 | 29 | ||||||
| 2025-08-14 | 13F | Vident Advisory, LLC | 11.279 | -65,99 | 32 | -67,02 | ||||
| 2025-07-28 | NP | IBBQ - Invesco Nasdaq Biotechnology ETF This fund is a listed as child fund of Invesco Ltd. and if that institution has disclosed ownership in this security, then these positions will not be double counted when calculating total shares and total value | 2.443 | 26,12 | 10 | 42,86 | ||||
| 2025-07-15 | 13F | Fifth Third Bancorp | 60 | 0,00 | 0 | |||||
| 2025-04-09 | 13F | Green Alpha Advisors, LLC | 0 | -100,00 | 0 | |||||
| 2025-08-14 | 13F | DAFNA Capital Management LLC | 811.046 | 14,06 | 2.271 | 11,66 | ||||
| 2025-08-12 | 13F | Gladstone Institutional Advisory LLC | 37.270 | 104 | ||||||
| 2025-06-10 | 13F/A | Militia Capital Partners, LP | 0 | -100,00 | 0 | -100,00 | ||||
| 2025-08-05 | 13F | Westside Investment Management, Inc. | 900 | 0,00 | 3 | 0,00 | ||||
| 2025-08-14 | 13F | LMR Partners LLP | Call | 62.400 | 175 | |||||
| 2025-08-05 | 13F | Intellectus Partners, LLC | 10.100 | 0,00 | 28 | 0,00 | ||||
| 2025-05-15 | 13F | Propel Bio Management, LLC | 0 | -100,00 | 0 | |||||
| 2025-07-30 | NP | SBIO - ALPS Medical Breakthroughs ETF | 64.499 | 21,43 | 268 | 28,85 | ||||
| 2025-08-11 | 13F | Bridger Management, Llc | 147.209 | 412 | ||||||
| 2025-08-14 | 13F | Susquehanna Portfolio Strategies, LLC | 399.963 | 1.120 | ||||||
| 2025-08-14 | 13F | Susquehanna International Group, Llp | 108.557 | 41,31 | 304 | 38,36 | ||||
| 2025-05-09 | 13F | R Squared Ltd | 0 | -100,00 | 0 | |||||
| 2025-08-11 | 13F | Nikko Asset Management Americas, Inc. | 216.511 | -5,92 | 606 | -7,48 | ||||
| 2025-08-14 | 13F | Susquehanna International Group, Llp | Call | 344.200 | 537,41 | 964 | 525,32 | |||
| 2025-06-26 | NP | Voya Prime Rate Trust | 61.188 | 0,00 | 244 | -7,60 | ||||
| 2025-08-14 | 13F | Susquehanna International Group, Llp | Put | 187.300 | 446,06 | 524 | 434,69 | |||
| 2025-09-04 | 13F/A | Advisor Group Holdings, Inc. | 7.624 | -54,82 | 21 | -56,25 | ||||
| 2025-08-12 | 13F | Jpmorgan Chase & Co | 6.440 | 50,40 | 18 | 50,00 | ||||
| 2025-08-14 | 13F | Banque Transatlantique SA | 0 | -100,00 | 0 | |||||
| 2025-08-14 | 13F | PFM Health Sciences, LP | 1.779.259 | 294,28 | 4.982 | 286,12 | ||||
| 2025-07-11 | 13F | Farther Finance Advisors, LLC | 1.000 | 3.233,33 | 3 | |||||
| 2025-05-15 | 13F | Glen Eagle Advisors, LLC | 0 | -100,00 | 0 | |||||
| 2025-08-14 | 13F | Bayesian Capital Management, LP | 0 | -100,00 | 0 | |||||
| 2025-07-30 | 13F | Crewe Advisors LLC | 1.945 | 0,00 | 5 | 0,00 | ||||
| 2025-08-06 | 13F | Nvwm, Llc | 202 | 0,00 | 1 | |||||
| 2025-08-08 | 13F | Geode Capital Management, Llc | 27.622 | -34,50 | 77 | -35,83 | ||||
| 2025-08-26 | NP | AZBAX - AllianzGI Small-Cap Fund Class A | 0 | -100,00 | 0 | -100,00 | ||||
| 2025-08-14 | 13F | Oasis Management Co Ltd. | 107.911 | 0,00 | 302 | -1,95 | ||||
| 2025-07-18 | 13F | TruNorth Capital Management, LLC | 60 | 0,00 | 0 | |||||
| 2025-08-14 | 13F | Graham Capital Management, L.P. | 19.213 | 54 | ||||||
| 2025-07-14 | 13F | Painted Porch Advisors LLC | 0 | -100,00 | 0 | |||||
| 2025-08-14 | 13F | Ally Bridge Group (NY) LLC | 1.485.000 | 4.158 | ||||||
| 2025-08-14 | 13F | Saba Capital Management, L.P. | 151.033 | 0,00 | 423 | -2,09 | ||||
| 2025-08-14 | 13F | State Street Corp | 24.111 | -1,57 | 68 | -4,29 | ||||
| 2025-08-07 | 13F | Acadian Asset Management Llc | 0 | -100,00 | 0 | |||||
| 2025-07-16 | 13F | Crowley Wealth Management, Inc. | 30 | 0,00 | 0 | |||||
| 2025-08-14 | 13F | Hrt Financial Lp | 18.096 | 0 | ||||||
| 2025-08-07 | 13F | CENTRAL TRUST Co | 100 | 0,00 | 0 | |||||
| 2025-08-14 | 13F | Strategic Wealth Designers | 20 | 0 | ||||||
| 2025-08-14 | 13F | Founders Fund VII Management, LLC | 278.880 | 0,00 | 781 | -2,13 | ||||
| 2025-08-13 | 13F | Renaissance Technologies Llc | 212.800 | 80,05 | 596 | 76,04 | ||||
| 2025-08-12 | 13F | Dynamic Technology Lab Private Ltd | 0 | -100,00 | 0 | |||||
| 2025-08-14 | 13F | Prelude Capital Management, Llc | 66.975 | 188 | ||||||
| 2025-08-11 | 13F | Citigroup Inc | 10.180 | 1.023,62 | 29 | 1.300,00 | ||||
| 2025-08-08 | 13F | Good Life Advisors, LLC | 145.000 | -19,44 | 406 | -21,01 | ||||
| 2025-08-14 | 13F | Raymond James Financial Inc | 7.535 | 21 | ||||||
| 2025-07-29 | 13F | Tradewinds Capital Management, LLC | 14 | 0,00 | 0 | |||||
| 2025-08-14 | 13F | Point72 Asset Management, L.P. | 0 | -100,00 | 0 | |||||
| 2025-08-12 | 13F | CIBC Private Wealth Group, LLC | 23 | 0,00 | 0 | |||||
| 2025-08-14 | 13F | Two Sigma Investments, Lp | 114.592 | -31,49 | 321 | -33,05 | ||||
| 2025-08-13 | 13F | Aisling Capital Management LP | 1.198.418 | 0,00 | 3.356 | -2,10 | ||||
| 2025-08-14 | 13F | Millennium Management Llc | Call | 200.000 | 560 | |||||
| 2025-08-14 | 13F | Millennium Management Llc | 1.741.782 | -37,20 | 4.877 | -38,53 | ||||
| 2025-08-14 | 13F | TCG Crossover Management, LLC | 0 | -100,00 | 0 | |||||
| 2025-08-15 | 13F | Northeast Financial Consultants Inc | 21.000 | 59 | ||||||
| 2025-08-15 | 13F/A | Exome Asset Management LLC | 213.544 | 598 | ||||||
| 2025-05-14 | 13F | Walleye Trading LLC | Put | 0 | -100,00 | 0 | -100,00 | |||
| 2025-08-05 | 13F | Tsfg, Llc | 100 | 0,00 | 0 | |||||
| 2025-08-11 | 13F | HighTower Advisors, LLC | 11.242 | 4,51 | 31 | 3,33 | ||||
| 2025-08-11 | 13F | Fore Capital, LLC | 20.000 | -42,86 | 56 | -44,00 | ||||
| 2025-08-13 | 13F | Cerity Partners LLC | 10.214 | -0,71 | 29 | -3,45 | ||||
| 2025-08-18 | 13F | Wolverine Trading, Llc | 16.511 | 41,42 | 46 | 32,35 | ||||
| 2025-08-13 | 13F | Kilter Group LLC | 200 | 1 | ||||||
| 2025-08-18 | 13F | Wolverine Trading, Llc | Call | 57.100 | 302,11 | 158 | 285,37 | |||
| 2025-08-12 | 13F | MAI Capital Management | 800 | 0,00 | 2 | 0,00 | ||||
| 2025-08-14 | 13F | Atom Investors LP | 13.741 | -32,02 | 38 | -33,33 | ||||
| 2025-08-05 | 13F | Huntington National Bank | 501 | 0,00 | 1 | 0,00 | ||||
| 2025-07-22 | 13F | Old National Bancorp /in/ | 15.600 | 0,00 | 44 | -2,27 | ||||
| 2025-08-15 | 13F | State of Tennessee, Treasury Department | 0 | -100,00 | 0 | |||||
| 2025-07-22 | 13F | Gf Fund Management Co. Ltd. | 1.261 | 0,00 | 4 | 0,00 | ||||
| 2025-08-14 | 13F | Alliancebernstein L.p. | 0 | -100,00 | 0 | |||||
| 2025-08-14 | 13F | Wells Fargo & Company/mn | 142.645 | -8,02 | 399 | -9,93 | ||||
| 2025-08-14 | 13F | Daiwa Securities Group Inc. | 327 | 0 | ||||||
| 2025-06-25 | NP | BBC - Virtus LifeSci Biotech Clinical Trials ETF | 37.250 | 170,28 | 148 | 150,85 | ||||
| 2025-08-14 | 13F | Stifel Financial Corp | 22.100 | 0,00 | 62 | -3,17 | ||||
| 2025-08-14 | 13F | Logos Global Management LP | 0 | -100,00 | 0 |